The credit for this post goes to Philip. He is a new member who joined last year and has been one of Marcs private students. He has progressed massively since then and is now sharing his journey with us. Here is an article he wrote for us on candlesticks.
************************************************
A little while ago, a member in a sub-forum noticed that a lot of us traders place forward orders. He was curious if our trades were affected by not first checking the candlestick formations leading up to our triggers.
The thought there is that candlestick formations can give clues as to where the price will possibly go.
So, should we be looking at the formations to determine whether we should take a trade?
There are several different clues that I look for when eyeing a setup. While I pay attention to candlesticks, I don’t use them entirely for entries.
How I Use Candlestick Formations
Instead, I use them to place trendlines, and to help determine my take profits.
Specifically, I think Doji candles are among the most important for this.
Doji candlesticks can be identified with small candle bodies, and most times with wicks above and/or below. A Doji candle represents indecision, or where price ended where right it started (for that candle’s timeframe).
A Doji tells us where the price is “comfortable”. You can often see Doji candles surrounded by a lateral range of candles, indicating a comfort zone for price.
In return, and inadvertently, Doji candles aid in where and why I place entries, but not on their own.
They also aid me in where I should consider exiting a trade.
While in a trade, I look at charts and try to see where I think the price is “comfortable”, and consider moving my stop loss or putting my take profits in that area. I, too, will consider taking a percentage of profits off at those comfort zones, because it’s harder to tell whether price will continue with the move, stop, or reverse.
Doji In Action
An example of when I look for Dojis is when there’s a sudden big movement. I do this to catch a “correction trade”.
When a chart has a big move in either direction, I see if it moved away from a comfort zone. I see it more times than not where price shoots in a given direction and bonks its head on an EMA/trendline/Fib, then quickly retraces back toward its comfort zone.
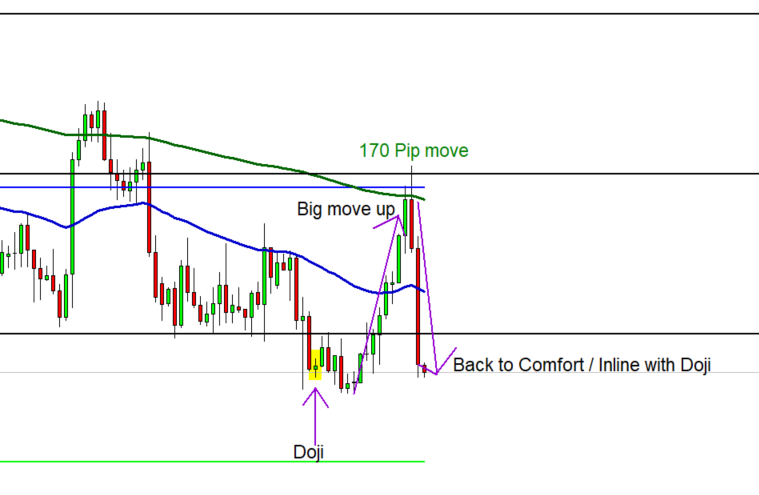
The USDCAD on the H4 perfectly shows what I’m talking about:
Hypothetically – I likely would’ve had my take profit where the doji candle is, and my trade would’ve just closed itself with a 170 pip profit. Not bad!
Another option would be to move the take profit lower and trail the stop loss, too.
It’s important to note that this is not a strategy – more so to be used in conjunction with your trading strategy.
I use the M2 strategy, where I primarily look for EMA’s, Fibs, and trendlines all converging to create a ‘roadblock’ for price to bounce or get rejected.
I hide my stop loss on the other side of the roadblocks, and set my take profits towards the high or low of the recent move. Although, I don’t put it all the way at the top or bottom, instead, I look for those Dojis to tell me where price will likely get comfortable.
What about other formations?
I, personally, do not have enough confidence in any formation to solely tell me to buy or sell. There are so many other factors at play.
Looking for candlestick formations should be towards the bottom of the list of trade requirements, and rarely required.
If you were thinking about taking that short on the USDCAD at the 200 EMA, and looked for the gravestone, harami, or bearish engulfing formations (reversal indicators), you wouldn’t have taken this trade. The opposite works, too, where you might take a trade based on a formation that would’ve been misleading.
In summary, candlestick formations can be used to add confluence, but should not be an isolated reason for taking a trade. They offer suggestions, but never facts.
I’d love to hear your opinions on how you use candlestick formations with your trades! Post your candlestick strategies in the forum (:
Regards,
Phil (flipsetrading)


