Candlestick formations are one of the most popular methods used by traders to analyse the forex market. This method has been around for centuries and is still widely used today due to its effectiveness in predicting market trends. But what are candlestick formations, and how can they help you achieve success in forex trading? In this blog post, we’ll delve deep into the secrets of candlestick formations and show you how to use them to your advantage in the forex market. Whether you’re a beginner or an experienced trader, this post will provide valuable insights that can help take your trading game to the next level. So, let’s get started!
Introduction to Candlestick Formations in Forex Trading
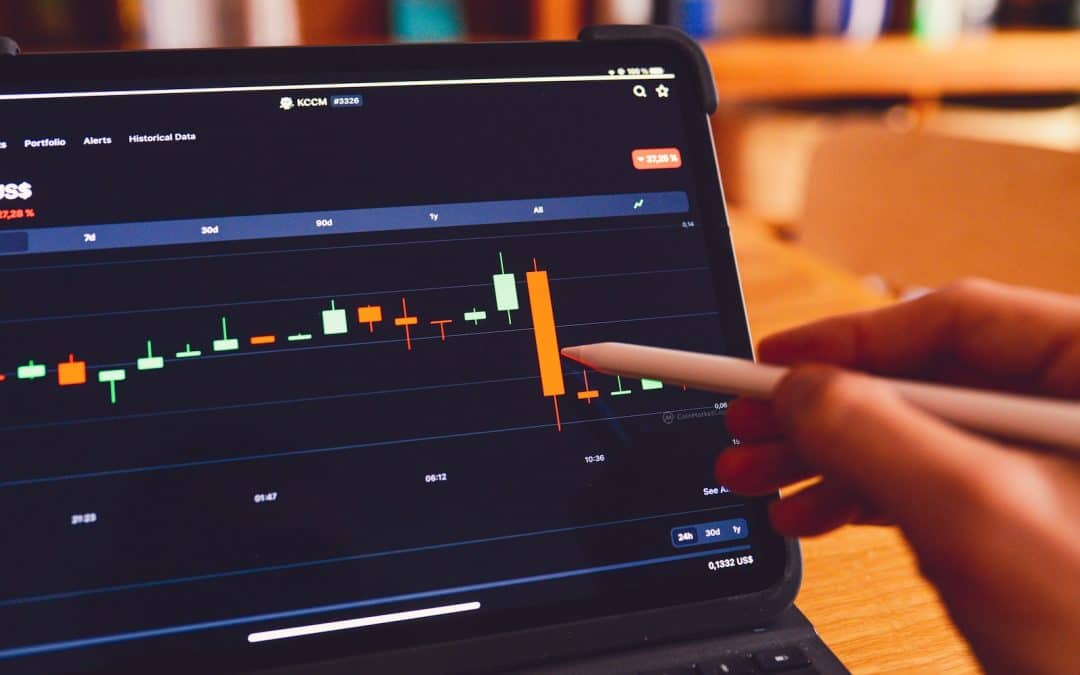
The use of candlestick formations in Forex trading is a widely accepted practice. This charting technique originated from Japan and has been used for centuries to predict future price movements. Candlesticks are useful because they provide a detailed analysis of market sentiment by indicating the open, close, high and low prices during a specific period.
This information can be used to identify trends, momentum shifts and potential reversals in price action. The simplicity yet accuracy of candlestick charts makes them an invaluable tool for traders looking to make well-informed decisions on when to enter or exit trades. Furthermore, mastering this skill could give you a competitive edge over other traders who may not use this technique or those who rely solely on technical indicators.
The Power of Japanese Candlesticks in Technical Analysis
Japanese candlesticks are a popular technical analysis tool for Forex traders. They provide insight into market trends and can be used to identify potential opportunities for profit. Candlestick charts display the high, low, opening and closing prices of an asset in a visually appealing way, making them easy to interpret even for beginners. The shapes and positions of candlesticks convey important information about price movements over time.
The power of Japanese candlesticks lies in their ability to capture both the psychological aspects of buying and selling as well as the fundamental factors affecting price changes. Analysts use patterns within these formations to predict future market actions. As a trader, it’s essential to learn how each individual component contributes to understanding price action overall so you can make informed decisions when placing trades based on this data alone or in conjunction with other indicators like moving averages or relative strength index (RSI).
Understanding the Anatomy of Candlestick Formations
Candlesticks are made up of different parts, each of which provides important information about the price action. The body of the candlestick represents the opening and closing prices of a currency pair. If the body is filled or colored, it means that the closing price was lower than the opening price. If it is empty or white, it means that the closing price was higher than the opening price. The wicks or shadows on either end of the body represent the highest and lowest prices reached during a trading session. The upper wick shows the highest price, while the lower wick shows the lowest price. Understanding these components is crucial in interpreting candlestick formations accurately and making informed trading decisions.

Common Patterns: Doji, Hammer and Shooting Star
Understanding the Doji candlestick pattern for successful forex trading
The Doji is a common candlestick pattern that signals indecision between buyers and sellers. It typically has a small real body with upper and lower shadows of similar length, creating a cross-like shape. When the Doji appears after a trend or during consolidation, it can suggest an upcoming reversal in price direction. However, when the Doji occurs during strong trends or volatile markets, it may indicate a temporary pause or hesitation before continuing in the same direction. Traders must be cautious when interpreting Doji formations and consider additional indicators to confirm potential trade opportunities. Understanding this key pattern is crucial for successful forex trading using candlesticks.
How to use the Hammer candlestick formations in your forex trading strategy
The Hammer candlestick formation is a powerful bullish reversal pattern that can signal a potential trend reversal in the market. It forms when the price opens lower than the previous close, but buyers step in and push the price up, closing near or above the opening price. This creates a long lower shadow and a small real body at the top of the candlestick. Traders can use this pattern to enter long positions, placing stop-loss orders below the low of the Hammer candlestick. However, it’s important to confirm this signal with other technical indicators and market analysis before making any trading decisions.
Identifying and profiting from the Shooting Star candlestick pattern
The Shooting Star is a bearish candlestick pattern that can signal a reversal in an uptrend. It has a small real body and a long upper shadow, which indicates that buyers drove the price up during the session but were ultimately overpowered by sellers who brought it back down. Traders look for this pattern to form at key resistance levels or after extended rallies, as it suggests market exhaustion and potential selling pressure. To profit from this pattern, traders typically enter short positions below the low of the Shooting Star with stop-losses above its high. However, confirmation through other indicators is recommended to reduce false signals.
Combining common patterns with other indicators for better decision making
Combining common patterns with other indicators for better decision making is crucial in Forex trading. By using multiple indicators, traders can confirm the signals given by candlestick formations and make more informed decisions. For instance, if a Doji pattern appears on a resistance level, it could indicate a potential reversal. However, combining it with the Relative Strength Index (RSI) can provide further confirmation of the reversal signal. Similarly, using Moving Averages with Hammer or Shooting Star patterns can help identify the strength of the trend and potential entry/exit points. By utilizing these techniques, traders can increase their chances of success in Forex trading.

Continuation Patterns: Bullish and Bearish Flags
Identifying Bullish and Bearish Flags in Candlestick Charts
Bullish and bearish flags are continuation patterns that traders use to identify a potential trend continuation after a brief pause. A bullish flag is formed when the price consolidates in a narrow range after an uptrend, forming a rectangular shape. The flagpole is the initial uptrend, and the consolidation represents profit-taking before the price continues to rise. On the other hand, a bearish flag is formed after a downtrend, with the consolidation representing a pause before further selling pressure resumes. Traders can identify these patterns by looking for price consolidations with decreasing volume and smaller candlestick ranges. These patterns can provide valuable insights into potential future price movements in forex trading.

Trading Strategies for Bullish Flag Continuation Patterns
To take advantage of bullish flag continuation patterns in forex trading, traders can use a few different strategies. One approach is to wait for the price to break above the upper boundary of the flag and then enter into a long position with a stop loss set at the lower boundary. Another strategy involves entering into a long position as soon as the price starts moving higher within the pattern, also with a stop loss at the lower boundary. Overall, traders should look for high volume during these bullish patterns and confirmations from other technical indicators before making any trades.
Spotting Opportunities: Analyzing Bearish Flag Patterns
Bearish flag formations occur when a downtrend pauses, taking the shape of a rectangular flag. This pattern is characterized by two parallel trend lines that are drawn to connect the highs and lows of price movements for a certain period. Typically, this confirms the continuation of the downtrend after a brief consolidation period. Traders can spot bearish flags by looking for short-term declines followed by sideways consolidation lasting several trading sessions with decreasing volume levels. To take advantage of this pattern, traders may enter a short position on breakouts below support level while setting stop-loss orders above resistance levels to mitigate risk.
Common Mistakes to Avoid When Trading with Candlestick Formations
When trading with candlestick formations in Forex, it’s important to avoid common mistakes that can lead to losses. One mistake is misidentifying continuation patterns, such as bullish and bearish flags. These patterns indicate a temporary pause in the trend before it continues in the same direction. However, traders may mistake them for reversal patterns and enter trades in the wrong direction. Another mistake is relying solely on candlestick formations without considering other indicators or market conditions. It’s important to use candlesticks in conjunction with other tools for better accuracy and confirmation of trends. By avoiding these mistakes, traders can effectively use candlestick formations for successful Forex trading.
Reversal Patterns: Head and Shoulders, Double Top/Bottoms
Reversal Patterns are important for traders to identify potential trend changes in the market. One of the most popular reversal patterns is the Head and Shoulders formation, which consists of a peak (left shoulder), a higher peak (head), and another lower peak (right shoulder). When the price breaks below the neckline, it signals a potential trend reversal. Another reversal pattern is the Double Top/Bottoms, which occurs when the price reaches a high or low twice before reversing. Traders should look for confirmation signals such as volume or other indicators before making a trade based on these patterns. It’s important to note that not all reversal patterns will result in a trend change, so it’s crucial to have a solid understanding of other technical analysis tools and market conditions before making any trading decisions.
Using Candlesticks for Entry and Exit Points in Trades
Entry and exit points are crucial in forex trading, and candlestick formations can help identify them. When a bullish pattern forms, such as a hammer or bullish engulfing, it may be a signal to enter a long position. Conversely, when a bearish pattern forms, such as a shooting star or bearish engulfing, it may be time to exit a long position or enter a short position.
It’s important to note that confirmation from other indicators is necessary before making any trades based solely on candlestick formations. For example, if a bullish pattern forms but the overall trend is bearish, it may not be wise to enter a long position. Additionally, traders should always set stop-loss orders to limit potential losses.
By using candlestick formations in conjunction with other technical analysis tools, traders can increase their chances of success in the forex market. However, it’s important to continually educate oneself on new developments and trends in order to stay ahead of the game.

Avoiding Common Pitfalls When Interpreting Candlestick Formations
Avoiding common pitfalls when interpreting candlestick charts is crucial for successful forex trading. One common mistake is relying solely on candlestick patterns without considering other technical indicators or market conditions. It’s important to remember that candlestick formations are just one tool in a trader’s arsenal and should be used in conjunction with other analysis methods.
Another pitfall is over-analyzing every single candlestick, which can lead to indecision and missed opportunities. It’s important to focus on the bigger picture and look for patterns over a longer time frame.
Additionally, it’s important to understand the context of the candlestick formation. For example, a doji pattern may indicate indecision in a ranging market but could also signal a potential reversal in a trending market.
Lastly, it’s important to avoid emotional reactions to individual candlesticks or patterns. Trading based on fear or greed can lead to impulsive decisions and losses. Instead, stick to a well-defined trading plan and use candlestick formations as part of your overall strategy.
Combining Other Indicators with Candlestick Formations for Better Accuracy
Combining multiple indicators with candlestick formations can enhance the accuracy of your analysis. One popular tool used alongside candlesticks is the Relative Strength Index (RSI), which measures overbought or oversold conditions in a market. When RSI readings align with a bullish reversal pattern, it provides added confirmation for entering into trades.
Another useful indicator to pair with candlesticks is Fibonacci retracements, which help identify potential support and resistance levels. By using Fibonacci levels alongside candlestick formations, traders can anticipate price movements and make better-informed decisions about entry and exit points.
It’s important to note that while combining indicators can be valuable, too many signals may lead to confusion or indecision. Stick to a few well-chosen tools that complement your trading style and give you confidence in your decision-making process.

Future Trends & Developments in Forex Trading using Candlesticks
Artificial Intelligence and machine learning are the future of Forex trading. With the help of these technologies, traders can now analyze vast amounts of data in real-time to make better decisions. In the future, we can expect to see more advanced algorithms that incorporate candlestick formations and other technical indicators to provide even more accurate predictions. Additionally, there is a growing trend towards social trading, where traders can follow and copy the trades of successful traders. This can be especially useful for novice traders who are just starting out in Forex trading. As technology continues to evolve, we can expect to see more innovative ways to use candlestick formations and other technical indicators for Forex success.
In conclusion, mastering the secrets of candlestick formations can greatly improve your success in forex trading. By understanding the power of Japanese candlesticks in technical analysis and becoming familiar with common patterns, reversal patterns, and continuation patterns, you can use candlesticks for entry and exit points in trades. However, it’s important to avoid common pitfalls when interpreting candlestick charts and supplement your analysis with other indicators for better accuracy. As technology continues to advance, we can expect future trends and developments in forex trading using candlestick formations. So keep learning and stay ahead of the game!


