Hi everyone,
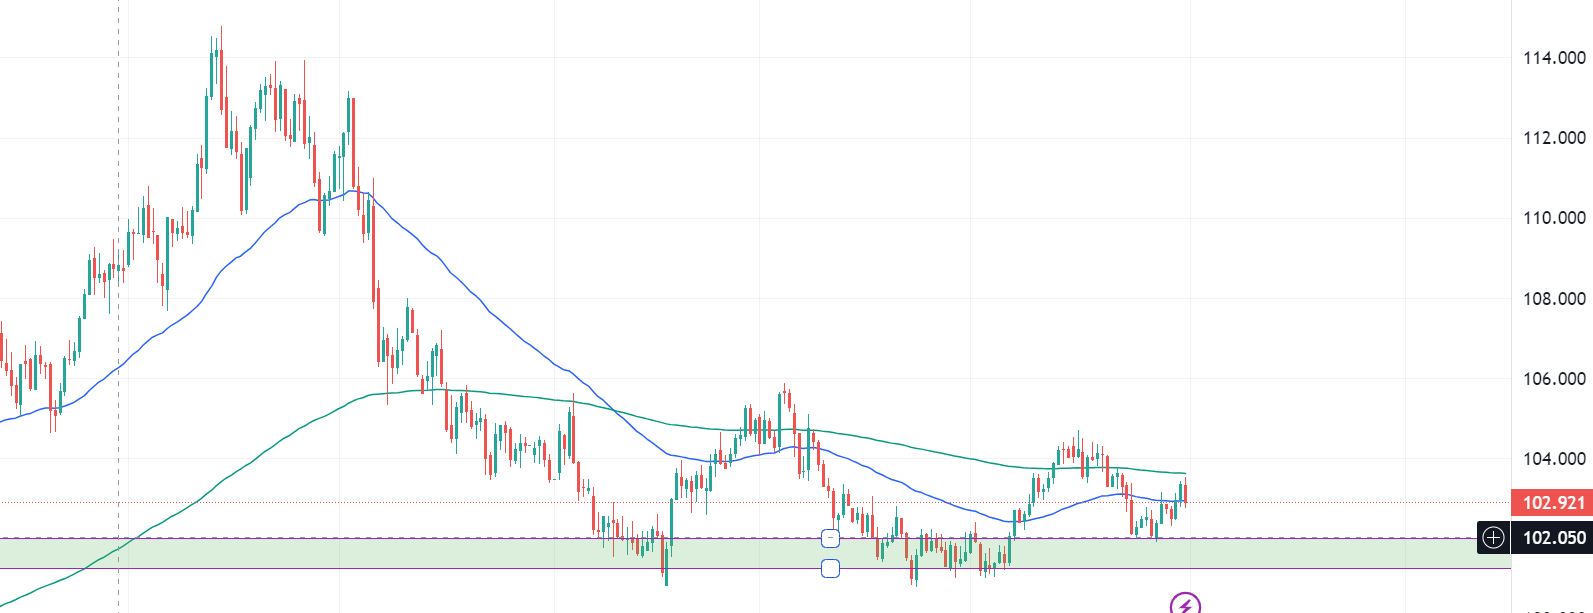
Weekly Analysis: Trend vs Ranges. It’s the start of a new month, which means a ton of red flag news this week. The battle against inflation rages on in the world and deciphering the various central bank clues and potential strategies has been really tricky the last while. I mentioned in my last live session that I was keeping an eye on the DXY chart for clues and structure and that hasn’t changed. Price is currently at a big area and is very much in a ‘make your mind up’ spot. I still believe a definitive move in either direction from here will see a longer term trend form. (I’ll talk a bit more about this in Tuesday’s live session).
This week let’s have a look at trending vs ranging markets;
Trend vs Ranging prices:
The percentage of time that prices are in a trend or ranging can vary depending on various factors, such as the time frame analysed and the specific market conditions. However, it’s important to note that defining what constitutes a trend or a ranging market can be subjective and may vary among traders. In general, trends are characterised by a sustained directional movement in prices, either upward (bullish trend) or downward (bearish trend). Ranging markets, on the other hand, occur when prices move within a relatively narrow range without displaying a clear trend. As a rough estimate, some traders suggest that trends occur approximately 30% to 40% of the time, while the remaining 60% to 70% of the time is spent in ranging or consolidation phases. These percentages are not set in stone and can vary depending on the market being analysed and the specific time frame considered.
Identifying trending markets is a crucial aspect of forex trading, as it allows traders to capitalise on the momentum and potential profit opportunities presented by sustained price movements. Some common methods to help identify trending markets:
-Moving Averages: Moving averages are widely used tools in trend analysis. By plotting a moving average on a price chart, traders can identify the overall direction of the market. In an uptrend, the price typically remains above the moving average, while in a downtrend, the price stays below.
-Trend Indicators: Technical indicators specifically designed to identify trends, such as the Moving Average Convergence Divergence (MACD) can be useful. These indicators provide numerical values or visual signals that indicate the strength and direction of a trend.
-Support and Resistance Levels: Trending markets often exhibit clear support and resistance levels. In an uptrend, the price tends to make higher highs and higher lows, with support levels acting as potential buying opportunities. Conversely, in a downtrend, lower highs and lower lows are observed, and resistance levels may present selling opportunities.
A few methods that can help identify ranging markets:
-Range Boundaries: By identifying the upper and lower boundaries of a range, traders can determine the range width. The upper boundary represents resistance, while the lower boundary represents support. The tighter the range, the more pronounced the ranging market.
-Moving Averages: In a ranging market, moving averages tend to flatten out, reflecting the lack of sustained directional movement. Traders may observe the price bouncing back and forth around the moving average without breaking away decisively.
-Sideways Price Movement: Ranging markets are characterised by sideways price movement, where the price fluctuates within a relatively tight range without displaying a clear trend in any direction. Traders can visually observe the lack of consistent higher highs and lower lows on the price chart.
Let’s look at some key charts
DXY chart:
Bounced off the 200 on Friday. Still at that big area we have spoken about.
Energy & Metal Prices;

Gold;
The stronger dollar put pressure on gold this week.
Oil;
Still at that big area.
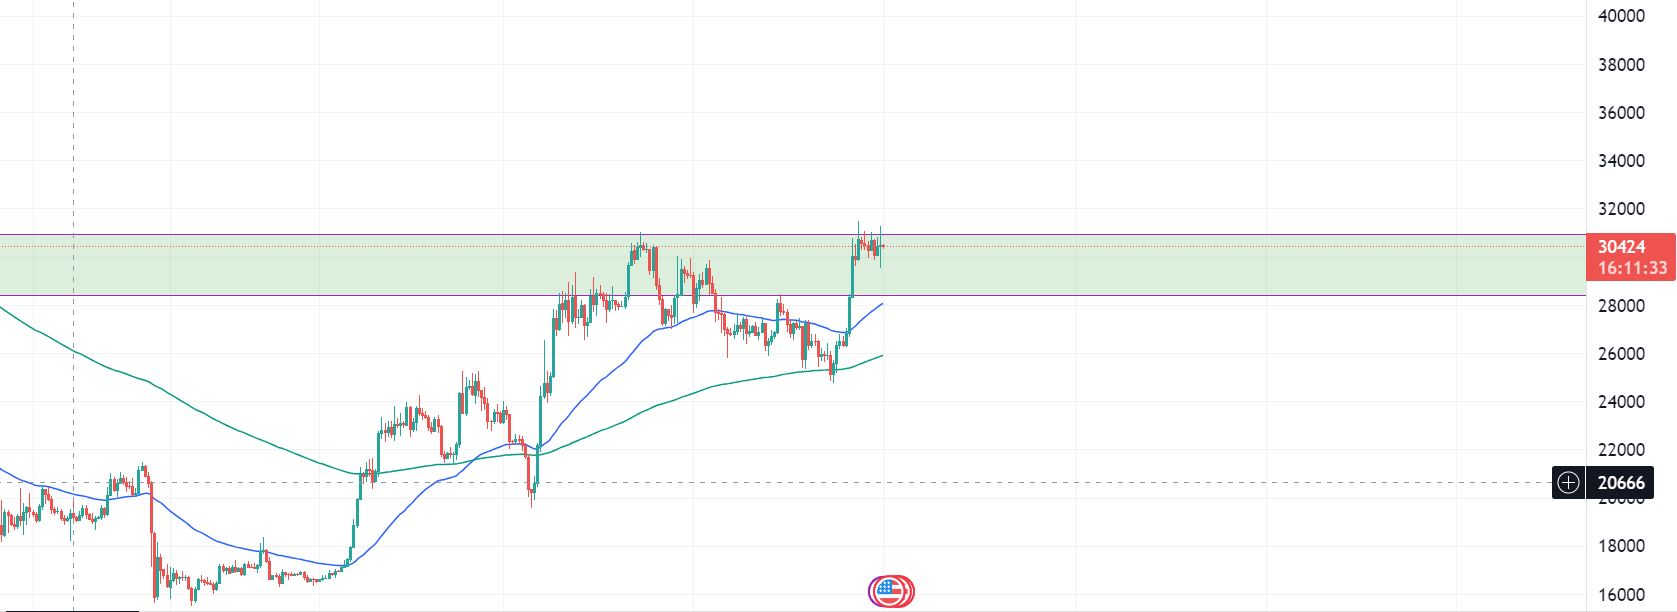
Bitcoin;
Consolidating at a big area now.
+++++++++++++++++++++++++++++
You can also follow us on Twitter https://twitter.com/marcwalton
+++++++++++++++++++++++++++++
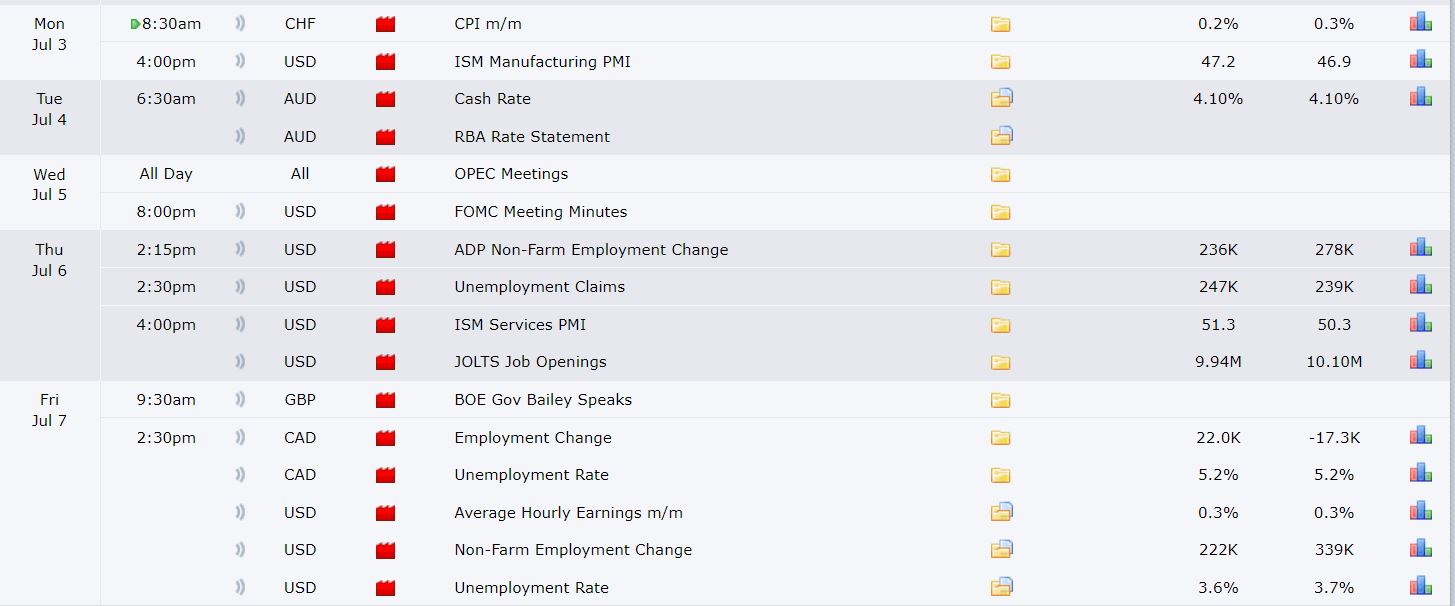
Red flag news:
FOMC + NON-FARMS THIS WEEK!
++++++++
MAJORS
EUR/USD: Long from 1.0730
USD/CHF: Short from 0.9230 (A grade) or 0.9020 (shorter timeframes) -Worked to the pip last week, but on Friday. Same idea as last time.
GBP/USD: Long from 1.23800 or if it breaks above 1.300 (See video).
AUD/USD: 0.6800 is key again for me. I’m going to see what happens at this level.
NZD/USD: Same idea as the AUD. 0.6200 is the key here (See video for these two pairs).
USD/CAD: Looking to short from 1.33200
USD/JPY: Leaving this alone -miles away from anything. Long from 135.00 or 136.00 potentially.
CROSSES
EUR/GBP: Short from 0.8650 again.
EUR/AUD: Long from 1.5800 (A grade) or 1.6200 on the shorter timeframes.
EUR/CAD: See video.
AUD/CAD: Short from 0.9000
GBP/AUD: Long from 1.8200
GBP/CAD: Looking on a 4H chart, I like the look of a long for the current position.
GBP/CHF: See video.
AUD/NZD: Long from 1.085 or 1.080 if it breaks lower.
As always, remember correlation! -Especially when taking more than one JPY trade!
M3 -Shorter timeframes.
I do my analysis on daily and weekly charts first and make a note of the MAJOR areas of support and resistance. Then copy them onto Pierre’s Earth and sky template. Then I make a note of the weekly & monthly pivots points and add them to the charts. You will see lots of opportunities line up during the week. The important thing then is to select a bias for the next few days and do NOT take trades if the price is too near a trend line or pivot. Ideally, you want to buy when the price is near a major support and or pivot point line and has the potential to make at least 40 pips. Vice versa for a short.
New members, please note: If I am looking to take a trade long, for example, 1.5000, I place my order 10 pips above & 10 pips below for a short. This is because price often does not quite reach a major line and you need to allow for spreads.
We are NOT a “tipping service” our aim is to teach you how to trade for yourself.
Watch the video below for more detailed explanations of this week’s analysis and trade plan (click the 4 arrows bottom right to view full-screen):
Regards
Thinus


